Predator-Prey Model by Rosenzweig
Introduction
This model implements an extension of the well-known Lotka-Volterra system.
It illustrates how to
- create a simple ODE model and
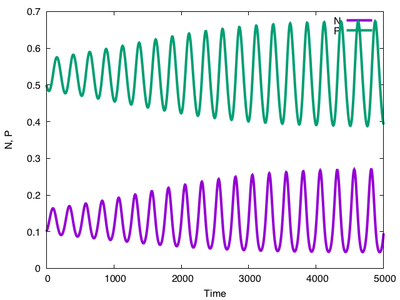
- log and plot data as time course.
Description
The Rosenzweig model is the Lotka-Volterra model with logistic growth and type 2 functional response.
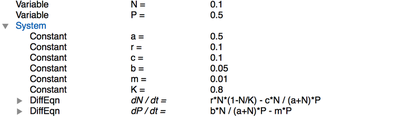
First, the Space and Time of a simulation is specified, here defined as a single lattice site and Global (see figure below), two Variables for predator and prey densities are set up. The differential equations themselves are specified in a System which consists of a number of Constants and two DiffEqn (differential equations) and are computed using the runge-kutta solver.
Output in terms of a text file as well as a plot is created by a Logger, the plugin in the Analysis section.
Things to try
- Bring the system into a stable steady state (fixed point, no oscillations) by changing parameters in
Global/System/Constant.
Reference
M. L. Rosenzweig: Paradox of Enrichment: Destabilization of Exploitation Ecosystems in Ecological Time. Science 171 (3969): 385-387, 1971.
Model
Examples → ODE → PredatorPrey.xml or
PredatorPrey.xml
XML Preview
<MorpheusModel version="4">
<Description>
<Title>Example-PredatorPrey</Title>
<Details>Example showing Predator-prey model by Rosenzweig.
The Rosenzweig model is the Lotka-Volterra model with logistic growth and type 2 functional response.
Reference:
Rosenzweig, Michael. 1971. "The Paradox of Enrichment" Science Vol. 171: pp. 385–387
Illustrates how to
- create a simple ODE model
- log and plot data as time course</Details>
</Description>
<Global>
<Variable value="0.1" symbol="N"/>
<Variable value="0.5" symbol="P"/>
<System time-step="0.1" solver="Runge-Kutta [fixed, O(4)]">
<Constant name="halftime" value="0.5" symbol="a"/>
<Constant name="growth rate" value="0.1" symbol="r"/>
<Constant name="consumption rate" value="0.1" symbol="c"/>
<Constant name="conversion rate" value="0.05" symbol="b"/>
<Constant name="mortality rate" value="0.01" symbol="m"/>
<Constant name="Carrying capacity" value="0.8" symbol="K"/>
<DiffEqn symbol-ref="N">
<Expression>r*N*(1-N/K) - c*N / (a+N)*P
</Expression>
</DiffEqn>
<DiffEqn symbol-ref="P">
<Expression>b*N / (a+N)*P - m*P</Expression>
</DiffEqn>
<!-- <Disabled>
<Function symbol="c">
<Expression>0.1 + time*0.00001</Expression>
</Function>
</Disabled>
-->
</System>
<Event trigger="when true" time-step="1">
<Condition>N < 0.001</Condition>
<Rule symbol-ref="N">
<Expression>0</Expression>
</Rule>
</Event>
</Global>
<Space>
<Lattice class="linear">
<Size value="1, 0, 0" symbol="size"/>
<Neighborhood>
<Order>1</Order>
</Neighborhood>
</Lattice>
<SpaceSymbol symbol="space"/>
</Space>
<Time>
<StartTime value="0"/>
<StopTime value="5000" symbol="stoptime"/>
<TimeSymbol symbol="time"/>
</Time>
<Analysis>
<Logger time-step="5">
<Input>
<Symbol symbol-ref="N"/>
<Symbol symbol-ref="P"/>
</Input>
<Output>
<TextOutput file-format="csv"/>
</Output>
<Plots>
<Plot time-step="-1">
<Style style="lines" line-width="2.0"/>
<Terminal terminal="png"/>
<X-axis>
<Symbol symbol-ref="time"/>
</X-axis>
<Y-axis>
<Symbol symbol-ref="N"/>
<Symbol symbol-ref="P"/>
</Y-axis>
</Plot>
<Plot time-step="-1">
<Style style="lines" line-width="2.0"/>
<Terminal terminal="png"/>
<X-axis>
<Symbol symbol-ref="N"/>
</X-axis>
<Y-axis>
<Symbol symbol-ref="P"/>
</Y-axis>
<Color-bar palette="rainbow">
<Symbol symbol-ref="time"/>
</Color-bar>
</Plot>
</Plots>
</Logger>
<ModelGraph include-tags="#untagged" format="svg" reduced="false"/>
</Analysis>
</MorpheusModel>
Downloads
Files associated with this model: