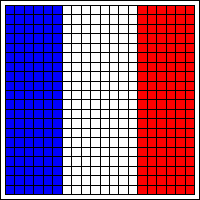
French Flag: Morphogen Gradient
Persistent Identifier
Use this permanent link to cite or share this Morpheus model:
Introduction
This example shows Wolpert’s classical French Flag model. Depending on the local concentration of a morphogen, cells adopt one of three cell types based on internal thresholds.

Description
The model sets up a morphogen gradient in the $x$ direction as a 2D field in the Global section. Note that no diffusion is used, since we use the steady-state solution of the diffusion and degradation process with fixed boundary source.
The cells in CellType register the (average) local morphogen concentration using a Mapper. Based on the specified threshold values, they choose an identity $I$ as defined in the Equation.
Note that this model is not time-dependent. Time is therefore set from StartTime $0$ to StopTime $0$.
Things to try
- Change the model such that the morphogen gradient is set up by production and diffusion, using
Diffusionand aSystemwithDiffEqn. That is, change the model into a time-dependent model.
Model
Examples → Miscellaneous → FrenchFlag.xml or
FrenchFlag.xml
XML Preview
<MorpheusModel version="3">
    <Description>
        <Title>Example-FrenchFlag</Title>
        <Details>Wolpert L (1969). "Positional information and the spatial pattern of cellular differentiation". J. Theor. Biol. 25 (1): 1–47.</Details>
    </Description>
    <Global>
        <Field symbol="m" value="c_0*exp(-k/D*(l.x/size.x))" name="morphogen gradient">
            <Diffusion rate="0.0"/>
        </Field>
        <Constant symbol="c_0" value="1.0"/>
        <Constant symbol="D" value="0.75"/>
        <Constant symbol="k" value="1"/>
        <Constant symbol="celltype" value="0.0"/>
    </Global>
    <Space>
        <Lattice class="square">
            <Size symbol="size" value="20 20 0"/>
            <NodeLength value="1"/>
            <BoundaryConditions>
                <Condition boundary="x" type="constant"/>
                <Condition boundary="y" type="constant"/>
            </BoundaryConditions>
            <Neighborhood>
                <Order>1</Order>
            </Neighborhood>
        </Lattice>
        <SpaceSymbol symbol="l" name="location"/>
    </Space>
    <Time>
        <StartTime value="0"/>
        <StopTime value="0"/>
        <TimeSymbol symbol="time"/>
    </Time>
    <CellTypes>
        <CellType class="biological" name="cells">
            <Property symbol="p" value="0.0" name="p"/>
            <Property symbol="celltype" value="0.0" name="cell type"/>
            <Constant symbol="t1" value="0.7"/>
            <Constant symbol="t2" value="0.4"/>
            <Equation symbol-ref="celltype">
                <Expression>if(p>t1,3, if(p>t2, 2, 1))</Expression>
            </Equation>
            <Mapper name="report morphogen concentration">
                <Input value="m"/>
                <Output symbol-ref="p" mapping="average"/>
            </Mapper>
        </CellType>
    </CellTypes>
    <CellPopulations>
        <Population size="0" type="cells">
            <InitCellLattice/>
        </Population>
    </CellPopulations>
    <Analysis>
        <Gnuplotter time-step="0">
            <Terminal opacity="0.5" persist="true" name="png"/>
            <Plot>
                <Cells value="celltype">
                    <ColorMap>
                        <Color value="3" color="blue"/>
                        <Color value="2" color="white"/>
                        <Color value="1" color="red"/>
                    </ColorMap>
                </Cells>
                <Field symbol-ref="m"/>
            </Plot>
        </Gnuplotter>
        <Logger time-step="0.0">
            <Input>
                <Symbol symbol-ref="m"/>
                <Symbol symbol-ref="celltype"/>
            </Input>
            <Output>
                <TextOutput/>
            </Output>
            <Restriction>
                <Slice value="size.y/2" axis="y"/>
            </Restriction>
            <Plots>
                <Plot>
                    <Style style="linespoints"/>
                    <Terminal terminal="png"/>
                    <X-axis>
                        <Symbol symbol-ref="l.x"/>
                    </X-axis>
                    <Y-axis>
                        <Symbol symbol-ref="m"/>
                        <Symbol symbol-ref="celltype"/>
                    </Y-axis>
                </Plot>
            </Plots>
        </Logger>
    </Analysis>
</MorpheusModel>
Downloads
Files associated with this model: