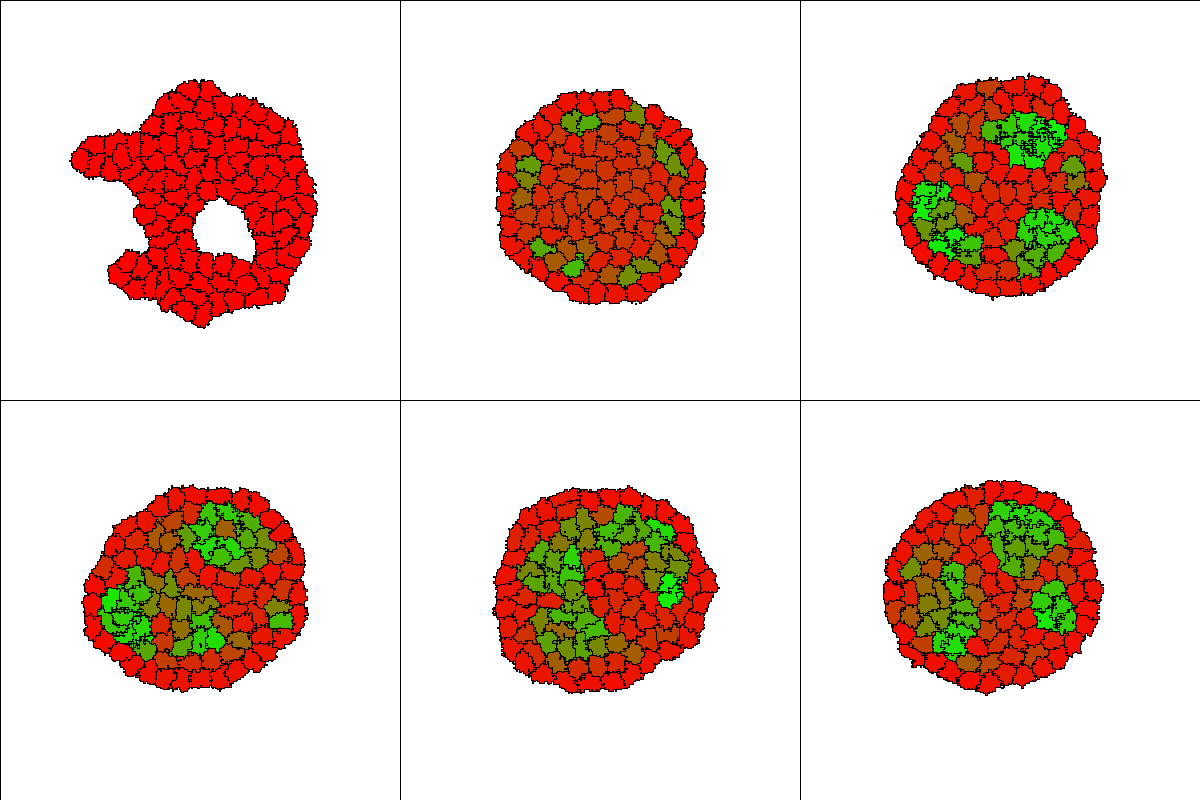
Single Genotype Circuit
Introduction
This model combines simple Notch signaling with the cellular Potts model (CPM), which drives cell sorting as a result of differential adhesion.
Model details are contained in the reference Mulberry and Keshet, 2020. Our computational model was inspired by the experimental work of Toda et al., 2018. The Notch signaling model was based on that of Boareto et al., 2015.
In this experiment, we consider a mixture of cells of a single genotype. These cells can become ‘activated’ through lateral inhibition and eventually self-organize into a stable two-layer structure.
Description
We model a mixture of cells which all have both sender and receiver capabilities:

The full Delta-Notch dynamics are given by the following system of differential equations:
where
Results
Cells (initially all red) aggregate into a single cluster quickly and are gradually induced by neighbors to differentiate into more adhesive (green) E-cadherin expressing cells, forming differentiated structures. The structures are dynamic, with cells continuously changing type. Since the process of cell differentiation continues (i.e. cell states are not fixed), the structure is imperfect; however, once a cell differentiates, it is quickly sorted into its respective layer.

Reference
N. Mulberry, L. Edelstein-Keshet: Self-organized Multicellular Structures from Simple Cell Signaling: A Computational Model. Phys. Biol. 17: 066003, 2020.
Model
SingleGenotypeCircuit.xml
XML Preview
<MorpheusModel version="4">
    <Description>
        <Title>Single Genotype to Two Layer Circuit</Title>
        <Details>Full title:		Single Genotype Circuit
Authors:		N. Mulberry, L. Edelstein-Keshet
Contributors:	N. Mulberry
Date:		24.03.2021
Software:		Morpheus (open-source). Download from https://morpheus.gitlab.io
Model ID:		https://identifiers.org/morpheus/M2053
Reference:		N. Mulberry, L. Edelstein-Keshet: Self-organized Multicellular Structures from Simple Cell Signaling: A Computational Model. Phys. Biol. 17: 066003, 2020. https://doi.org/10.1088/1478-3975/abb2dc
Comment:		Formation of two-layer structure starting from a single genotype. All cells are initially the same, but they specialize into receivers and senders.</Details>
    </Description>
    <Global>
        <Variable symbol="N" value="0"/>
        <Variable symbol="D" value="0"/>
        <Variable symbol="Nn" value="0"/>
        <Variable symbol="Dn" value="0"/>
        <Variable symbol="I" value="0"/>
        <Variable symbol="E" value="0"/>
        <Variable symbol="Ad" value="0"/>
    </Global>
    <Space>
        <SpaceSymbol symbol="l"/>
        <Lattice class="square">
            <Size symbol="size" value="300, 300, 0"/>
            <BoundaryConditions>
                <Condition type="noflux" boundary="x"/>
                <Condition type="noflux" boundary="y"/>
            </BoundaryConditions>
            <Neighborhood>
                <Order>1</Order>
            </Neighborhood>
        </Lattice>
    </Space>
    <Time>
        <StartTime value="0"/>
        <StopTime value="2e2"/>
        <TimeSymbol symbol="time"/>
    </Time>
    <CellTypes>
        <CellType class="biological" name="A">
            <VolumeConstraint target="200" strength="1"/>
            <Property symbol="N" name="notch" value="1e3"/>
            <Property symbol="Nn" name="notch_Neighbours" value="0.0"/>
            <Property symbol="D" name="delta" value="3e3"/>
            <Property symbol="Dn" name="delta_Neighbours" value="0.0"/>
            <Property symbol="I" name="NICD" value="0.0"/>
            <Property symbol="E" name="Ecad" value="0.0"/>
            <Property symbol="Ad" name="adhesive" value="0.0"/>
            <NeighborhoodReporter>
                <Input scaling="cell" value="N"/>
                <Output symbol-ref="Nn" mapping="average"/>
            </NeighborhoodReporter>
            <NeighborhoodReporter>
                <Input scaling="cell" value="D"/>
                <Output symbol-ref="Dn" mapping="average"/>
            </NeighborhoodReporter>
            <System time-step="0.1" time-scaling="1" solver="Runge-Kutta [fixed, O(4)]">
                <Constant symbol="Kc" value="5e-4"/>
                <Constant symbol="Kt" value="5e-5"/>
                <Constant symbol="N0" value="500"/>
                <Constant symbol="D0" value="1000"/>
                <Constant symbol="I0" value="200"/>
                <Constant symbol="gammaI" value="0.5"/>
                <Constant symbol="gamma" value="0.1"/>
                <Constant symbol="p" value="2"/>
                <DiffEqn symbol-ref="N">
                    <Expression>N0*(1+I^p/(I0^p+I^p)) - Kc*N*D - Kt*N*Dn - gamma*N</Expression>
                </DiffEqn>
                <DiffEqn symbol-ref="I">
                    <Expression>Kt*N*Dn - gammaI*I </Expression>
                </DiffEqn>
                <DiffEqn symbol-ref="D">
                    <Expression> D0*(I0^p/(I0^p+I^p)) - Kc*N*D - Kt*D*Nn - gamma*D</Expression>
                </DiffEqn>
                <DiffEqn symbol-ref="E">
                    <Expression> I^p/(I0^p+I^p) - gamma*E </Expression>
                </DiffEqn>
                <Constant symbol="Null" name="null" value="0.0"/>
            </System>
        </CellType>
        <CellType class="medium" name="medium"/>
    </CellTypes>
    <CPM>
        <Interaction>
            <Contact type1="A" type2="medium" value="22.0"/>
            <Contact type1="A" type2="A" value="16.0">
                <HomophilicAdhesion strength="-1.6" adhesive="E"/>
            </Contact>
        </Interaction>
        <MonteCarloSampler stepper="edgelist">
            <MCSDuration value="0.001"/>
            <Neighborhood>
                <Order>2</Order>
            </Neighborhood>
            <MetropolisKinetics temperature="10"/>
        </MonteCarloSampler>
        <ShapeSurface scaling="norm">
            <Neighborhood>
                <Order>6</Order>
            </Neighborhood>
        </ShapeSurface>
    </CPM>
    <CellPopulations>
        <Population type="A" size="0">
            <InitCircle number-of-cells="100" mode="random">
                <Dimensions radius="size.x/3" center="size.x/2, size.y/2, 0"/>
            </InitCircle>
        </Population>
    </CellPopulations>
    <Analysis>
        <Logger time-step="1">
            <Input>
                <Symbol symbol-ref="N"/>
                <Symbol symbol-ref="D"/>
                <Symbol symbol-ref="I"/>
                <Symbol symbol-ref="E"/>
                <Symbol symbol-ref="Ad"/>
            </Input>
            <Output>
                <TextOutput/>
            </Output>
        </Logger>
        <Gnuplotter time-step="1" decorate="false">
            <Terminal size="800 400 0" name="png" persist="true"/>
            <Plot>
                <Cells min="0.0" max="10.0" value="E">
                    <ColorMap>
                        <Color value="8.0" color="green"/>
                        <Color value="1.0" color="red"/>
                    </ColorMap>
                </Cells>
            </Plot>
        </Gnuplotter>
        <ClusteringTracker time-step="1.0" celltype="A"/>
        <ModelGraph format="dot" reduced="false" include-tags="#untagged"/>
    </Analysis>
</MorpheusModel>
Downloads
Files associated with this model: